Generate and visualize data in Python and MATLAB

Why take this course?
🎉 Course Headline:
🔍 Master Data Simulation & Visualization in Python and MATLAB
🚀 Generate and Visualize Data in Python and MATLAB for Data Science, Statistics, and Machine Learning
Course Description:
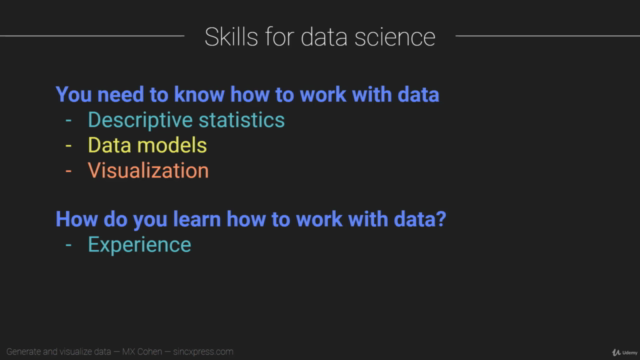
Data science is revolutionizing industries, academia, marketing, and research fields. While many courses focus on data analysis techniques, the key to effective data science lies in understanding data itself. 📊 Generate & Visualize Data in Python and MATLAB is designed to equip you with the skills to not only analyze but also generate and visualize the data that drives data science.
Key Takeaways:
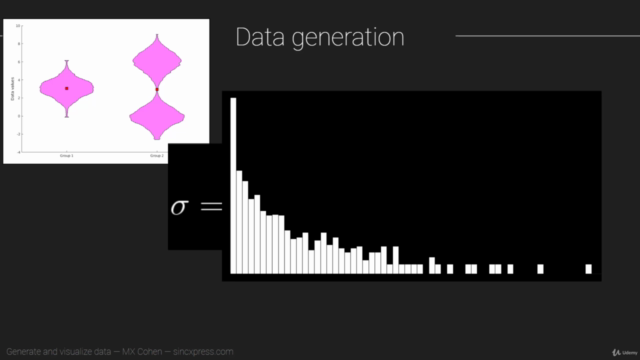
- Data Generation: Learn to create synthetic datasets for statistics, machine learning, classification, clustering, and more using models, equations, and parameters. 📈
- Data Visualization: Gain proficiency in visualizing data in 1D, 2D, and 3D across different data types. From simple plots to complex visualizations, you'll be able to present your findings clearly and effectively.
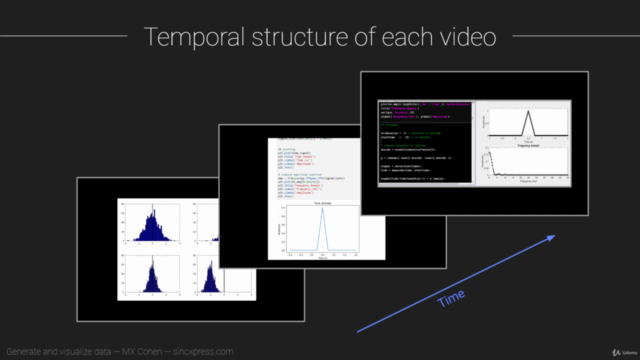
All videos come with detailed MATLAB and Python code for a hands-on learning experience.
Who is this course for?
This course is tailored for professionals and enthusiasts across various domains:
- Data Scientists
- Statisticians
- Computer Scientists (with an interest in MATLAB or Python)
- Signal Processors/Image Processors
- Biologists
- Engineers
- Students
- Independent Learners
Course Components:
- 📽️ Over 6 hours of video lectures with clear explanations, pictures, and diagrams to enhance your learning experience.
- PDF readers with important notes and key concepts for quick reference.
- Exercises with their solutions to test your understanding and reinforce learning.
- A rich collection of MATLAB code and Python code (over 4000 lines) to practice and enhance your programming skills, especially in data analysis, statistics, and machine learning contexts.
Prerequisites:
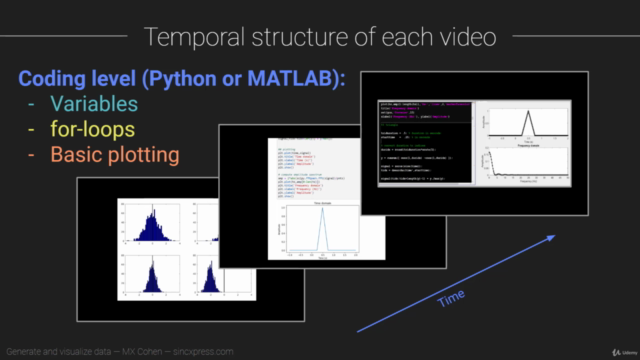
To maximize the benefits of this course, you should have some prior experience with either Python or MATLAB programming. You don't need to be an advanced coder, but a comfort level with variables, loops, and basic plotting is recommended. 🛠️
Join us on this data-filled journey and unlock the full potential of your data analysis capabilities! 🚀
Sign up today and transform your approach to data science, visualization, and machine learning with Python and MATLAB! 🌟
Course Gallery


Loading charts...