R Tidyverse Reporting and Analytics for Excel Users

Why take this course?
🌟 From Excel to Big Data and Interactive Dashboard Visualizations in Just 5 Hours! 🌟
Course Title: R Tidyverse Reporting and Analytics for Excel Users
Course Description:
Are you an Excel enthusiast looking to expand your data analytics capabilities without diving deep into complex statistical techniques? Look no further! This course is tailored specifically for you. 📊✨
Why Choose R with Tidyverse?
- Familiar Terrain: Transition smoothly from Excel, leveraging your existing skills.
- Efficiency: Perform operations on large datasets at lightning speed.
- Simplicity: Work directly with your data as simply as in Excel, but with the might of a powerful programming language.
- Versatility: Explore and analyze data with a plethora of methods that go beyond Excel's capabilities.
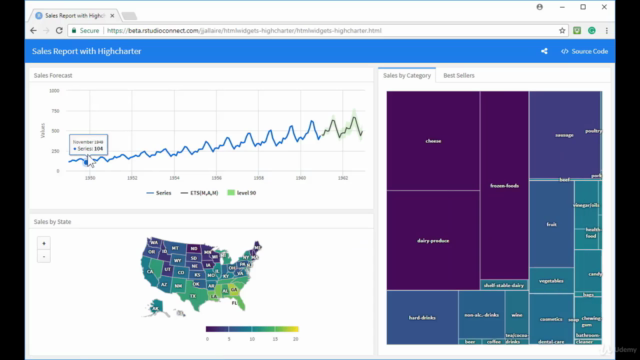
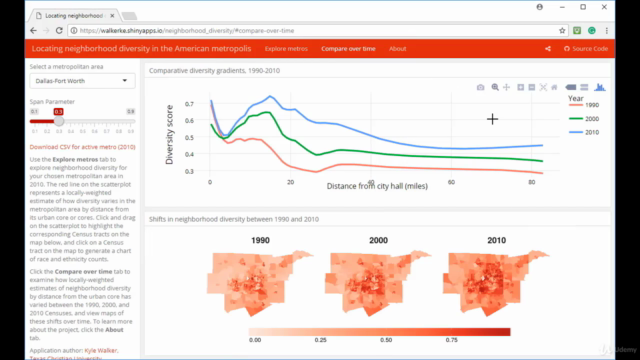
- Visualization: Create rich, interactive dashboards with ease.
- Accessibility: Share your work effortlessly across teams without version conflicts or file locking issues.
- Collaboration: Utilize GitHub for seamless teamwork and version control.
Who is this course for?
- Excel users who want to elevate their reporting analytics.
- Anyone looking for a more efficient way to handle large datasets.
- Users seeking to create interactive visualizations without extensive coding knowledge.
- Teams that need to collaborate on data projects with better tools.
What will you learn?
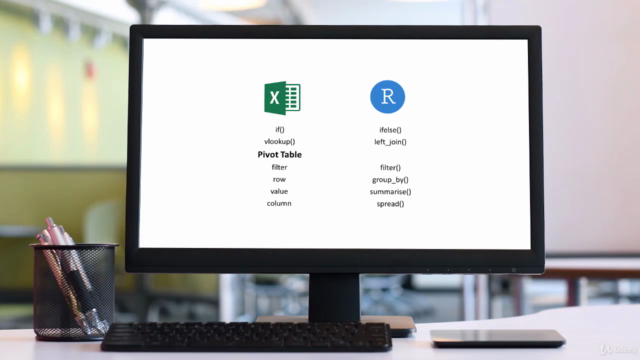
- Performance: Replace time-consuming Excel operations like
VLOOKUPandSUMIFSwith R functions, cutting down processing times from minutes to seconds. 🏃♂️ - Exploration & Analysis: Use R's Tidyverse to efficiently explore your data, perform complex analysis, and present results in a familiar tabular format or beyond.
- Visualization: Craft dashboards and visualizations that are more dynamic and informative than what Excel offers. 📈
- Distribution: Share your results as simple Excel files, csvs, or deploy them as web apps accessible on any device.
- Collaboration: Work with teams in a more efficient manner using tools like GitHub for version control and collaboration. 🤝
Benefits of R with Tidyverse:
- Speed: Automate your data analysis processes from the start, saving time and effort.
- Reproducibility: Ensure that your work is reproducible and automated for consistent results every time.
- Flexibility: Enjoy the freedom to grow into advanced statistical techniques when you're ready.
Instructor Insight:
Having spent years mastering Excel, I thought R was too complex for everyday use. But I discovered that R with Tidyverse is the powerful yet simple tool I wish I had learned about 20 years ago! It allows you to focus on your data rather than the tools, leading to new insights and perspectives. 🧐✨
Join us in this transformative learning journey and unlock the full potential of your data with R Tidyverse Reporting and Analytics for Excel Users. Let's elevate your analytics game together! 🚀
Course Gallery


Loading charts...