Python Data Science basics with Numpy, Pandas and Matplotlib

Why take this course?
🚀 Course Title: Python Data Science Basics with Numpy, Pandas, and Matplotlib
🎓 Instructor: Abhilash Nelson
Course Overview:
Embark on a comprehensive journey into the world of Python for Data Science and Machine Learning. This beginner-friendly course covers all essential topics and libraries necessary to kickstart your data analysis adventure! 📊🤓
What You'll Learn:
-
Python Fundamentals: Understand the basics of Python, its applications, and explore the key data science libraries—NumPy and Pandas.
-
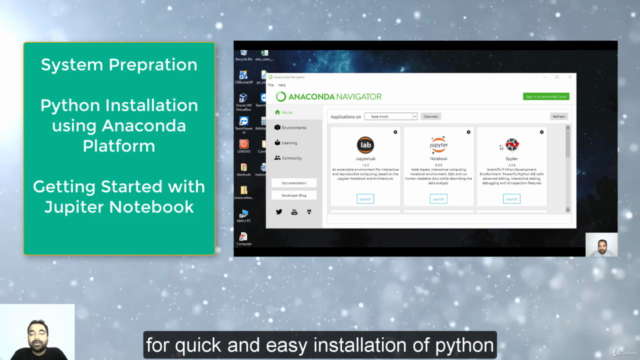
Python Installation & Setup: Get hands-on with installing Python and setting up Anaconda, along with navigating Jupyter Notebook, your new coding environment.
-
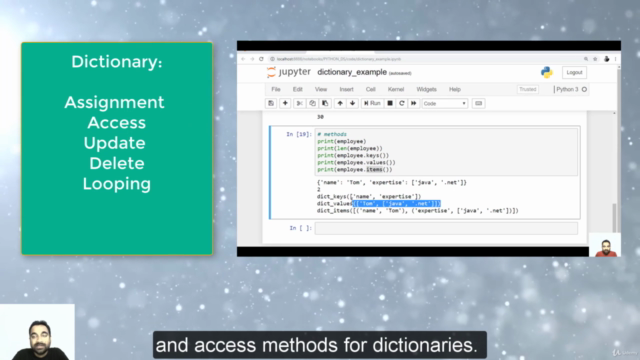
Python Data Types: Master strings, numbers, lists, tuples, sets, and dictionaries—learn their operations and how to manipulate them effectively.
-
NumPy Library: Dive into NumPy for array creation, reshaping, and statistical computations. Discover the power of multi-dimensional arrays and perform essential array operations with ease.
-
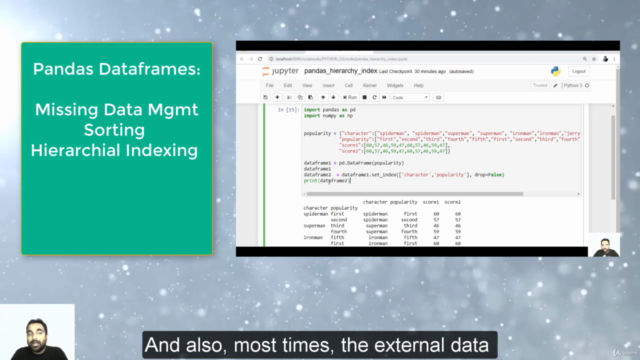
Pandas Library: Tackle real-world data structures with Pandas. Learn to work with Series, DataFrames, and handle missing or empty data. Import external data from CSV and JSON formats, and master data manipulation techniques like concatenation, joining, merging, and pivoting.
-
DataFrame Grouping & Aggregation: Group your data intelligently and perform complex aggregations using Pandas' powerful groupby functionality.
-
Custom Indexing & Data Cleaning: Learn to customize indexes, rename columns, and perform collective replacements within a DataFrame. Discover methods for counting unique values and identifying duplicate entries.
-
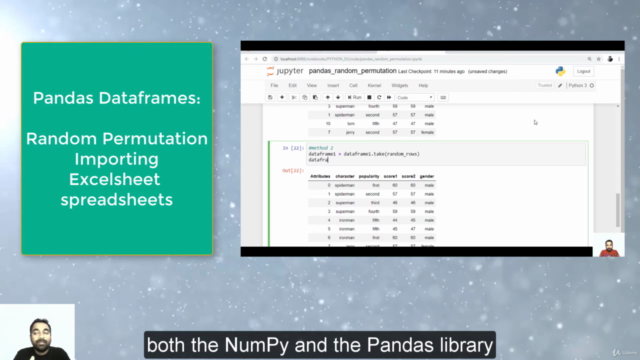
Random Permutation & Excel Integration: Explore permutation techniques with both NumPy and Pandas. Load data from an Excel spreadsheet and select values based on conditions, including using lambda functions.
-
Cross Tabulation & Data Visualization: Create contingency tables for cross tabulation and learn to visualize your data effectively with Matplotlib, customizing plots and graphs to present your findings clearly.
-
Histograms & Advanced Graphing: Understand the nuances of histograms and gain experience in plotting different types of visualizations with Matplotlib.
Why Take This Course?
-
Essential Skills: Acquire fundamental skills for data analysis that are critical for data science and machine learning projects.
-
Practical Application: Learn by doing, with practical exercises that will help you understand the real-world applications of these libraries.
-
Flexible Learning: Access to course materials and exercises anytime, anywhere—learn at your own pace on any device.
-
Community Support: Join a community of like-minded learners and experts. Collaborate, share insights, and grow together.
-
Experience Certificate: Upon successful completion of the course, earn an experience certificate to showcase your new skills. (Availability may vary based on learning platform.)
Get Started Today!
Whether you're a beginner or looking to solidify your data science foundation, this course is tailored for you. 🛠️🚀 Enroll now and transform your data into actionable insights with Python, NumPy, Pandas, and Matplotlib!
Course Gallery


Loading charts...