Data Wrangling and Exploratory Data Analysis with R

Why take this course?
🎓 Master Data Wrangling and EDA with R's Tidyverse 📊✨
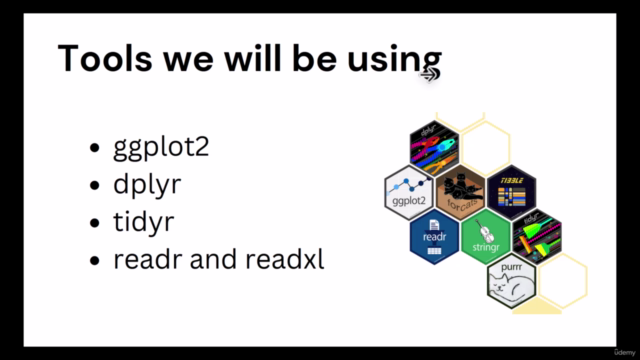
Welcome to the "Data Wrangling and Exploratory Data Analysis with R" course, where you'll dive into the world of data handling and visualization using the powerful tidyverse package in R. 🐘
Course Instructor: Ridwan Adejumo Suleiman
Course Title: Explore and Visualize Various Datasets Using The Tidyverse Packages
What's Inside the Course?
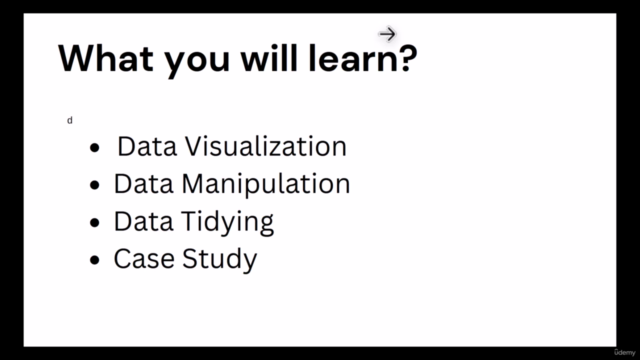
This course is meticulously structured into 7 sections, each designed to build your skills in a step-by-step approach. Let's break down what you'll learn:
Section 1: Introduction 🎈
Discover the essence of this course and get familiar with the tools at your disposal. This is where your data analysis journey begins!
Section 2: Data Visualization with ggplot2 📈
- Barplots
- Boxplots
- Scatterplots
- Line plots
- Histograms
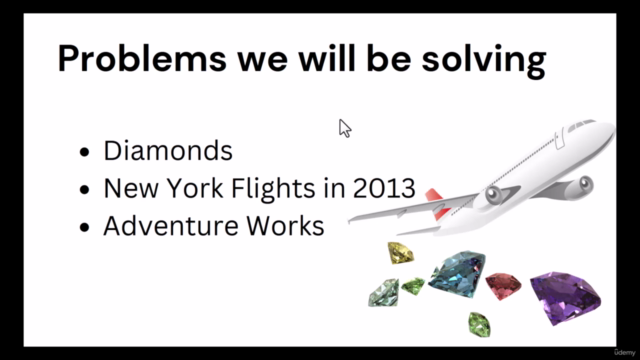
Explore the power of ggplot2 using the iconic diamonds dataset. By the end of this section, you'll not only know how to create these visualizations but also interpret them effectively.
Section 3: Data Manipulation with dplyr ⚙️
Work with the New York flights database from 2013 and learn to manipulate datasets using dplyr. You'll become adept at tasks such as:
- Filtering
- Arranging
- Renaming
- Creating new variables
- Selecting specific columns
- Joining datasets together
Test your knowledge with a Practical Quiz that will solidify the concepts you've learned.
Section 4: Data Tidying with tidyr 🔄
Tidy datasets are the backbone of efficient data analysis. Learn how to transform your data into a tidy format, whether it's making datasets longer or wider, and master the art of column manipulation using tidyr.
Section 5: Importing Data with tibbles 🗂️
Discover the modernized approach to data frames in R with tibbles, and learn how to import various structured data formats, including CSV and XLSX files.
Section 6: Case Study: Adventure Works Database 🏋️♂️
Apply your newfound skills to a real-world dataset. The Adventure Works database will challenge you to combine the techniques learned throughout the course and demonstrate what a typical data analyst's workflow process entails.
Section 7: EXAM 🤔
Test your understanding of the entire course with a comprehensive final exam consisting of 20 multiple-choice questions. This is your chance to showcase what you've learned and earn your course certificate! 🏆
By the end of this course, you will have a robust skill set in data wrangling and exploratory data analysis with R's tidyverse. You'll be able to tackle real-world datasets, visualize your findings, and tell compelling stories through data.
Join us on this data-driven adventure and transform the way you interact with data! 🚀
Course Gallery


Loading charts...