Microsoft 365 Power BI Desktop - Beginner

Why take this course?
🌟 Course Headline: Unlock the Power of Data with Microsoft 365 Power BI Desktop - Beginner 🌟
🚀 Course Title: Microsoft 365 Power BI Desktop - Beginner
By: Intellezy Trainers
Course Description:
Dive into the World of Data Visualization with Power BI Desktop!
Why Power BI Desktop? Power BI Desktop is the go-to tool for anyone looking to transform raw data into compelling, interactive visualizations. As a beginner, this course will equip you with the foundational skills to extract meaningful insights from complex datasets, enabling you to make informed business decisions.
What You'll Learn:
-
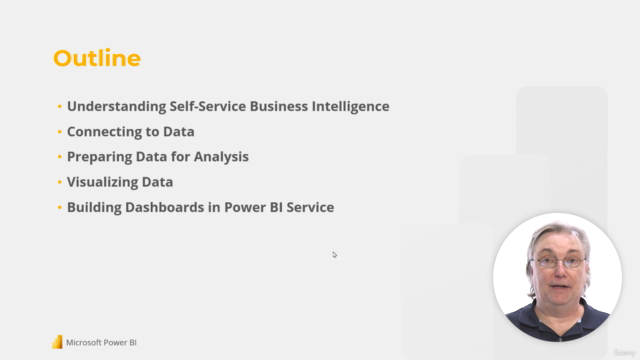
Business Intelligence Fundamentals: We'll kick off the course by demystifying key Business Intelligence concepts and their importance in today's data-driven world.
-
Data Connectivity: Master connecting to various data sources, from simple Excel workbooks to more complex SQL databases, and even Power BI Service.
-
Data Preparation: Learn how to prep your data for analysis using Power BI Desktop's powerful tools for cleansing and shaping your data before any analysis takes place.
Hands-On Visualization Creation:
-
Tables and Matrices: Learn how to present your data clearly and effectively with these essential visualizations.
-
Text Based Visuals: Craft compelling narratives through well-designed text elements within your reports.
-
Column Charts, Line Charts, and More: Discover the right chart for your data, and learn when to use each type for maximum impact. We'll cover:
- Interactive Legends
- Waterfall Charts
- Funnel Chars
- Scatter Plot Charts with motion
- Area and Stacked Area Charts
-
Gauges and KPIs: Learn to create dashboards that highlight your most critical metrics at a glance.
Advanced Interactive Dashboards:
- Power BI Service: Elevate your visualizations by sharing them with interactive dashboards via the Power BI Service, enhancing collaboration within your organization.
Course Highlights:
📈 Visualization Mastery: You'll leave this course with a solid understanding of how to create a variety of visualizations and when to use each type effectively.
⚙️ Real-World Application: Through demonstrations, you'll see the practical applications of data preparation and visualization in real-world scenarios.
👥 Community Engagement: Connect with peers and share experiences as you learn and grow within the Power BI community.
Who Should Take This Course?
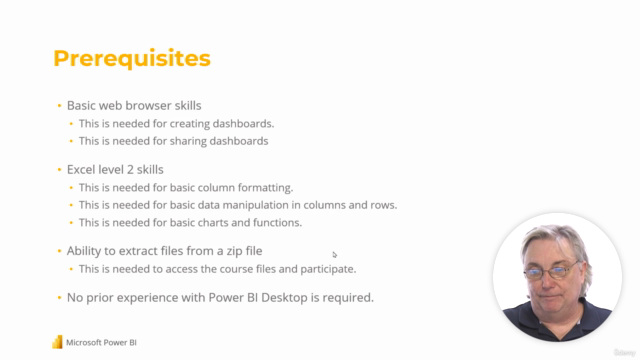
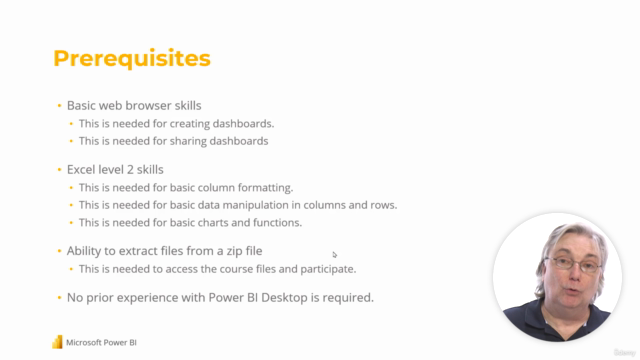
This course is perfect for beginners who are new to Power BI Desktop and looking to gain a foundational understanding of data analysis and visualization within the Microsoft 365 ecosystem. Whether you're an analyst, a student, or someone interested in self-service analytics, this course will provide you with the skills needed to harness the power of your data.
Enroll Now to Embark on Your Data Visualization Journey!
Join us and become proficient in transforming data into actionable insights with Microsoft 365 Power BI Desktop. Sign up today and take the first step towards becoming a data visualization expert! 📊🚀
Course Gallery


Loading charts...