Panel and hvPlot: A high-level Data Visualization for Python

Why take this course?
🌟 Course Title: Panel and hvPlot: A High-Level Data Visualization for Python
Course Headline:
"Simplify Visualization and Interactive Dashboards with Super Easy and Flexible Holoviz tools including Panel and hvPlot!"
Course Description:
🔍 Unleash the Power of Data Visualization in Python with Panel and hvPlot!
In this comprehensive Udemy course, you'll dive into the mesmerizing world of high-level data visualization techniques using two of Python's most powerful libraries: Panel and hvPlot. 🚀 Whether you're a seasoned data scientist, a curious analyst, or an innovative developer, this course is designed to elevate your data visualization skills to new heights.
By the end of this course, you will be able to:
-
🧵 Master the fundamentals of Panel and hvPlot: Get a deep understanding of how these libraries operate within the Python ecosystem and learn to leverage their full potential for your data visualization projects.
-
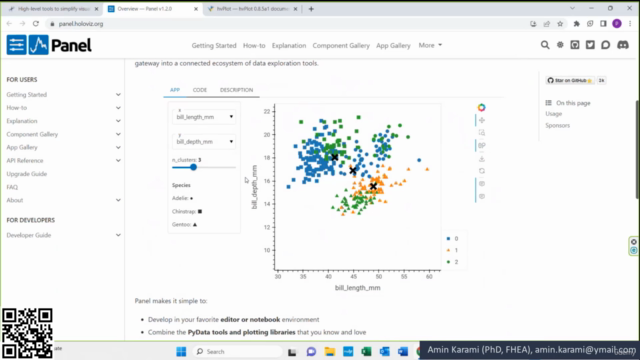
✨ Create interactive dashboards: Design captivating interactive data dashboards with Panel, making it intuitive for users to interact with and analyze the data that matters most to them.
-
📊 Enhance visualizations with hvPlot: Explore the rich functionality of hvPlot to create dynamic and compelling visualizations, from simple charts to complex multi-dimensional graphics.
-
🔄 Integrate Panel and hvPlot with existing workflows: Effortlessly integrate these libraries into your current Python data analysis workflows, enhancing the power of data manipulation libraries like Pandas and NumPy.
-
🎨 Customize and style your visualizations: Discover how to tailor your visualizations to fit your specific needs, adding a touch of professionalism and uniqueness to your dashboards.
-
🚀 Deploy and share your dashboards: Learn the best practices for deploying interactive dashboards created with Panel and hvPlot, allowing you to collaborate effectively and showcase your work to the world.
-
🤝 Manage data visualization challenges in your real-world projects: Apply what you've learned to solve practical data visualization challenges, ensuring that your skills are battle-tested and ready for the professional arena.
By the end of this course, you will have harnessed the power of Panel and hvPlot to create powerful interactive data visualizations and dashboards. You'll be equipped with the knowledge to transform complex datasets into compelling narratives, making you a formidable force in the realm of data visualization.
🌈 Enroll now and join a community of learners who are ready to take their Python data visualization skills to the next level with Panel and hvPlot! 💫
Don't miss out on the opportunity to become a data visualization expert. Enroll in this course today, and start creating visualizations that stand out! 🎉
Course Gallery


Loading charts...
Comidoc Review
Our Verdict
While there's room for improvement in hands-on exercises and data manipulation, this Panel and hvPlot course truly excels in enabling learners to create interactive dashboards and visually appealing visualizations. Delivering a 4.92 global rating from 310 subscribers, it proves itself as one of the top-tier resources for expanding your Python data visualization skillset.
What We Liked
- Comprehensive coverage of Panel and hvPlot, perfect for both beginners and experienced Python users looking to enhance data visualization skills.
- Interactive dashboard creation using Panel, enabling ease in data exploration and analysis.
- hvPlot's powerful capabilities to create dynamic visualizations with a wide range of chart types and customizations.
- Guidance on integrating Panel and hvPlot into existing Python workflows, ensuring compatibility with popular libraries.
Potential Drawbacks
- Limited focus on data manipulation and analysis; additional knowledge in this area may be required for optimal results.
- Lacks substantial hands-on exercises or projects to reinforce concepts and apply newly acquired skills.
- Minor inconsistencies in pacing across the course can occasionally make learning challenging.
- Customization and styling techniques could benefit from more in-depth exploration and real-world examples.