OriginPro: Data Plotting and Analysis

Why take this course?
GroupLayout: OriginLab - OriginPro: Data Plotting and Analysis
Headline: 🚀 Master OriginPro from Scratch! 🚀
Are you ready to dive into the world of data plotting and analysis with OriginPro? Whether you're a researcher, student, or data enthusiast, this comprehensive course will guide you through every step, from installation to complex data analysis. Let's embark on this journey together! 🧭
Course Description:
1. Installation and Basic Operations: 🔧
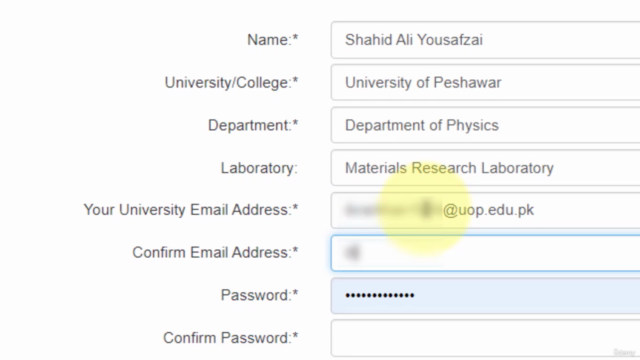
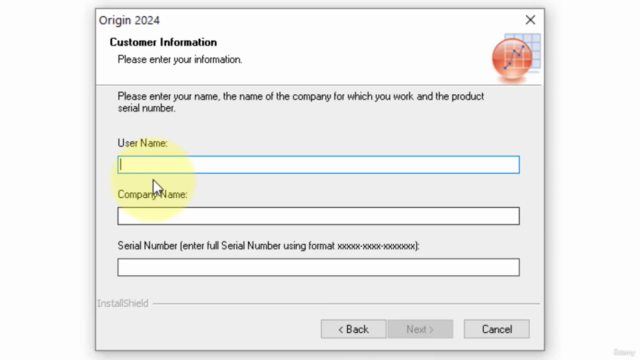
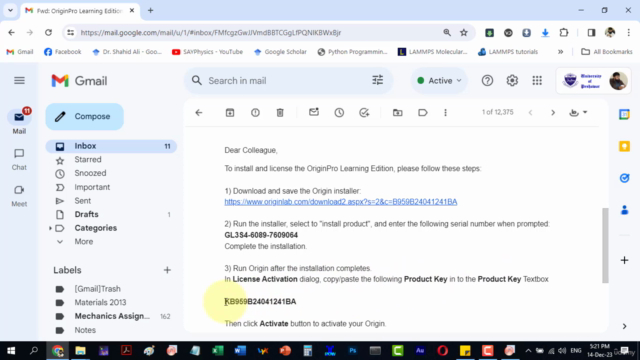
- How to Download and Install Origin Software for Free
- Get started with a seamless installation process.
- Understand the user interface and basic operations to begin your data analysis journey.
2. Data Import and Graph Basics: 📊
- How to import data files in Origin
- Learn the easy way to bring your data into Origin.
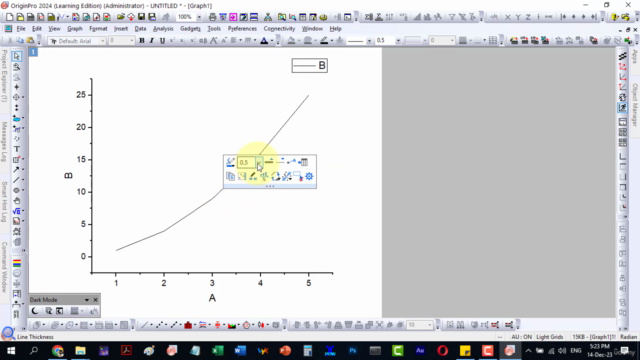
- Line graph, Scatter graph, Line-Scatter graph in Origin:
- Create various types of graphs to visualize your data effectively.
- Y offset or Y stack plots in Origin:
- Master advanced plotting techniques to interpret your data with clarity.
3. Graph Customization and Management: 🎨
- How to customize a graph in Origin
- Personalize your graphs to highlight key findings.
- How to merge multiple graphs in Origin
- Combine graphs for a comprehensive visual data presentation.
- How to export or save a graph in Origin
- Share your results with ease.
- How to insert an inset in a graph in Origin
- Add detail views to your plots.
- How to remove glitches and correct a graph in Origin
- Ensure your visualizations are accurate and pristine.
4. Data Manipulation and Analysis: 🔬
- How to plot data with X and Y error bars in Origin
- Account for variability in your data points.
- How to extract data points from a plot in Origin
- Gain insights by pulling out specific data points.
- Normalize data, perform baseline corrections, and subtract baselines in Origin
- Learn to refine your data for more accurate analysis.
- How to find peaks, label peaks, and calculate FWHM in Origin
- Identify important features of your data.
- How to smooth plots and graphs in Origin
- Improve the readability of your visualizations.
- Deconvolute peaks and perform curve fitting (linear, polynomial, exponential decay, Gaussian distribution) in Origin
- Fit curves to your data for a better understanding of the underlying processes.
- FWHM vs Integral Breadth analysis in Origin
- Understand the differences and applications of these two methods.
- How to find the area under the curve using Origin
- Quantify the integral of your data points accurately.
5. Advanced Data Analysis: 🧙♂️
- Curve fitting of multiple peaks in Origin
- Analyze complex datasets with multi-peak fitting.
- Set up custom analysis templates, perform batch processing, and conduct descriptive statistics on statistical data in Origin
- Streamline your workflow with automated processes.
- Cross tabulation, chi-square, distribution fit, and hypothesis t-tests on statistical data in Origin
- Perform robust statistical analyses to validate your findings.
6. Application-specific Techniques: 🔄
- How to plot and normalize FTIR and UV-VIS data in Origin
- Work with spectroscopy data to reveal molecular insights.
- How to smooth XRD graph in Origin
- Analyze crystal structures with precision.
- Baseline correction for XRD and FTIR in Origin
- Correct for instrumental baselines to ensure accurate data interpretation.
This breakdown should offer a more organized view of the course's content, allowing learners to navigate through the material more efficiently based on their specific learning needs. Dive into the world of data plotting and analysis with OriginPro, and unlock the potential of your data! 🌟
Ready to enroll and transform your data into compelling visual narratives? Click now to join this enriching course and elevate your data analysis skills to the next level with OriginPro! 📚✨
Course Gallery


Loading charts...