Monitoring, Observability and Alerting with Prometheus

Why take this course?
🚀 Infrastructure Monitoring, Observability and Alerting with Prometheus 🚀
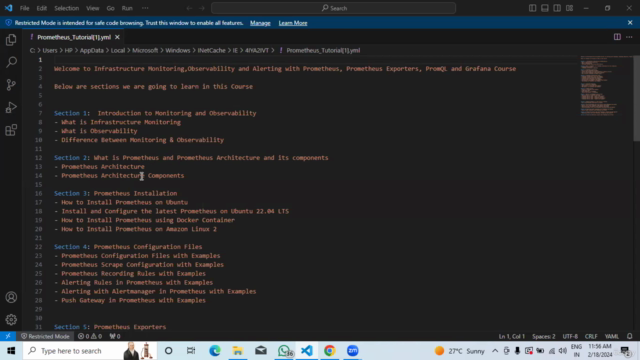
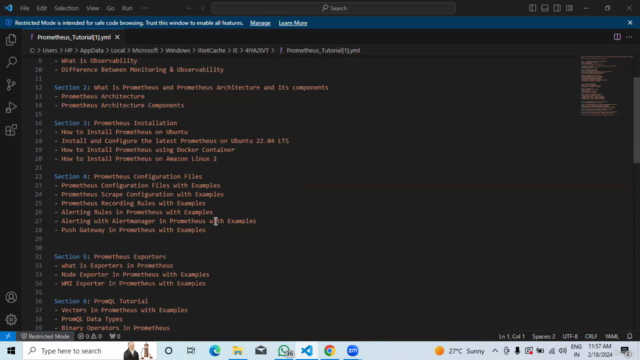
Are you ready to dive into the world of Monitoring, Observability and Alerting? This comprehensive online course is designed to transform your understanding and application of these critical components using the powerful tools Prometheus, PromQL, and Grafana. Whether you're a seasoned DevOps engineer or just starting out, this course will equip you with the knowledge and skills to effectively monitor, troubleshoot, and alert on your systems. 🛠️🔍
Course Highlights:
✅ Understanding Prometheus - Learn about the architecture, data collection, and storage in Prometheus.
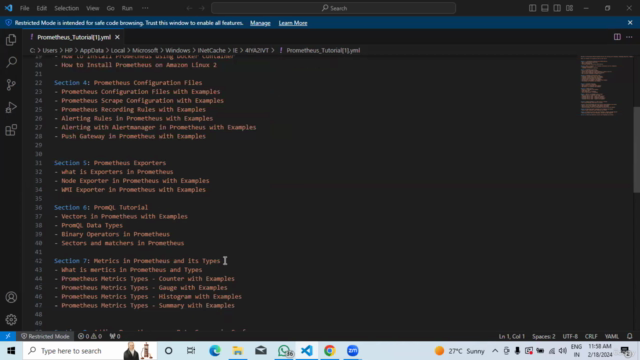
🚀 Getting Hands-On with Metrics - Explore Prometheus metrics types like Counter, Gauge, Histogram, and Summary with real-world examples.
📊 Mastering PromQL - Discover how to use PromQL for querying time series data, understanding its syntax, data types, and operators.
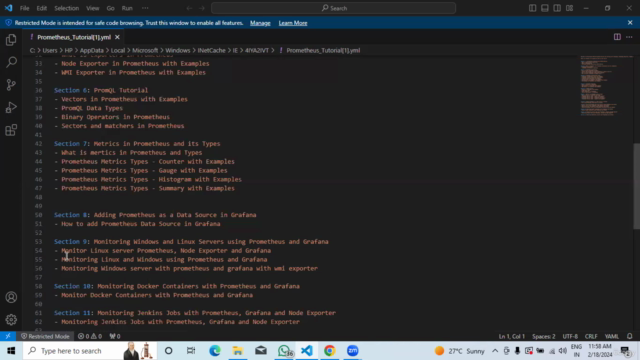
�ashboard:Grafana Integration - Add Prometheus as a data source in Grafana and create insightful dashboards to visualize your metrics effectively.
📦 Monitoring Docker Containers - Learn how to monitor your Docker containers' health and performance using Prometheus and Grafana.
🔧 Observability for Linux & Windows Servers - Gain insights into server performance, system health, and application metrics for both Linux and Windows environments.
🖥️ Monitoring Jenkins Jobs - Understand how to monitor Jenkins jobs to ensure your CI/CD pipelines are running smoothly.
🌐 Kubernetes Cluster Monitoring - Dive into monitoring Kubernetes clusters, understanding the challenges and best practices for Prometheus and Grafana in a containerized environment.
Course Breakdown:
-
Introduction to Prometheus - Understanding its role as an open-source monitoring solution.
-
Setting Up Prometheus - Installing and configuring your Prometheus server.
-
Metrics in Prometheus - Learn about different metric types and how they function.
-
PromQL Deep Dive - Querying metrics, understanding binary operators, sectors, and matchers.
-
Grafana with Prometheus - Adding Prometheus as a data source and creating dashboards.
-
Monitoring Linux Servers - Tools like Node Exporter for system performance metrics.
-
Monitoring Windows Servers - Using WMI Exporter to monitor Windows-specific metrics.
-
Observability in Docker Containers - Techniques and tools for monitoring container health.
-
Monitoring Jenkins Jobs - Observability practices for CI/CD pipelines.
-
Kubernetes Cluster Monitoring - Best practices and challenges in monitoring complex Kubernetes environments.
Why Take This Course?
- Hands-On Learning - Engage with real-world examples and practical exercises to solidify your knowledge.
- Industry-Relevant Skills - Equip yourself with skills that are highly sought after in the job market.
- Expert Instructors - Learn from professionals who have extensive experience in monitoring, observability, and alerting.
- Community Support - Join a community of like-minded learners to share knowledge, experiences, and support.
- Flexible Learning - Access course materials anytime, anywhere, fitting learning into your schedule effortlessly.
🎓 Whether you're looking to upskill, transition roles, or simply expand your technical expertise, this course will provide you with the tools and knowledge to excel in monitoring and observability. Enroll now and become a master of infrastructure monitoring with Prometheus, PromQL, and Grafana! 🎓
Sign Up Now and embark on your journey to mastering Monitoring, Observability, and Alerting today! 🌟
Course Gallery


Loading charts...