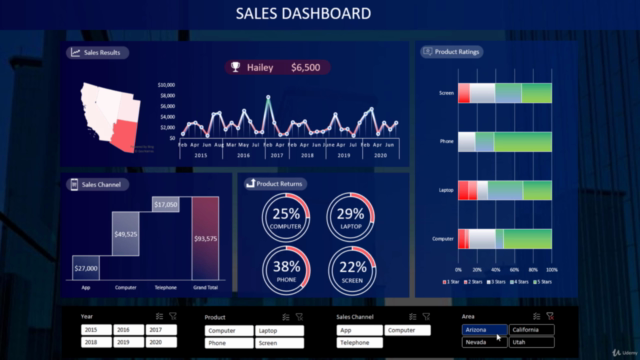
Microsoft Excel Intermediate - Creating a Dashboard

Why take this course?
🌟 Course Title: Microsoft Excel Intermediate - Creating a Dashboard
Course Headline: 🚀 Learn how to create an amazing looking Microsoft Excel dashboard in this project-based course! 📊
Unlock the Power of Data with Microsoft Excel!
Are you ready to elevate your data analysis skills to the next level? Whether you're a professional navigating complex spreadsheets, a student tackling capstone projects, or an enthusiast eager to explore Excel's capabilities – this Microsoft Excel Intermediate - Creating a Dashboard course is your perfect guide.
Why Take This Course?
- 🔍 Hands-On Learning: Engage in real-world projects that mirror actual workplace scenarios, ensuring you learn by doing.
- 👩🏫 Step-by-Step Guidance: No prior Excel knowledge required! We'll start from the fundamentals of PivotTables and build up to creating a dynamic dashboard.
- 🔍 Interactive Experience: Learn through practical tasks that will have you applying what you learn in a tangible, engaging manner.
Course Overview:
- Understanding Pivot Tables: We'll begin by demystifying the world of PivotTables and how they form the backbone of your dashboard.
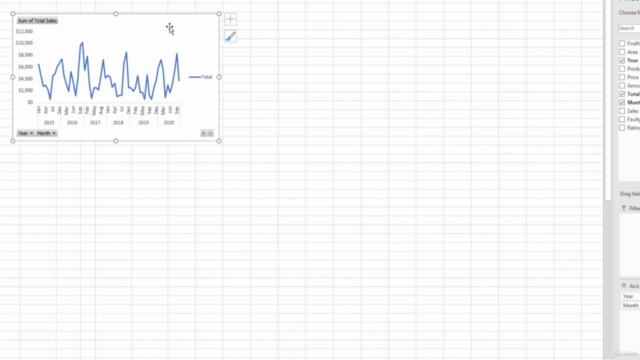
- Mastering Charts: Discover various types of charts and learn which ones to use for effective data visualization within your dashboard.
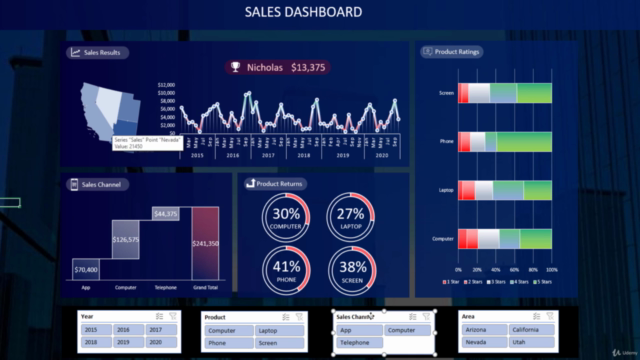
- ✨ Slicers & Visuals: Take your dashboards to the next level by enhancing them with sleek slicers, and visually appealing elements that make data digestible and insightful.
- Automation & Refresh: Learn how to set up your dashboard to automatically update when new data is added, saving you time and effort.
- Designing Your Dashboard: We'll wrap up by putting all the pieces together to design an engaging and interactive dashboard that will impress any audience.
What You Will Learn:
- ✅ The essence of PivotTables in creating dynamic data summaries.
- ✅ How to create, configure, and customize various charts for your dashboard.
- ✨ Enhancing dashboards with advanced slicers and visual design tips.
- ⏱ Setting up real-time data updates for your dashboard.
- 🎨 Design principles to build an amazing looking dashboard that stands out.
By the end of this course, you will:
- Confidently create PivotTables from scratch and understand their role in data analysis.
- Be able to select and implement the correct chart types for your data storytelling needs.
- Know how to design slicers that are both functional and aesthetically pleasing.
- Have learned how to ensure your dashboard updates automatically with new data sets.
- Possess the skills to create a professional, insightful Excel dashboard that can be used for decision making and data presentation.
Ready to transform your data into compelling visuals? Enroll in "Microsoft Excel Intermediate - Creating a Dashboard" today! 🌟
Course Gallery


Loading charts...