Microsoft Excel Dashboards Crash Course for Advanced Users
Learn to create interactive stunning visuals all from within Excel in this 2 hr crash course for Excel Dashboards!
4.71 (229 reviews)

8 226
students
1.5 hours
content
Nov 2022
last update
FREE
regular price
Why take this course?
Microsoft Excel Dashboards Crash Course for Advanced Users 🚀✨
Your Journey to Excel Mastery Begins Here!
Course Instructor: Robin Solonenko
Headline: 📊✨ Unlock the Power of Data Visualization - Create Interactive Dashboards in Microsoft Excel in Just 2 Hours!
Key Takeaways:
- INDEX & MATCH: Master these powerful functions to select data with precision.
- IFS Functions: Learn how to handle multiple conditions in a single formula.
- LARGE vs SMALL: Discover how to find the largest or smallest values effortlessly.
- CHOOSE Function: Learn how to pick from a list of options dynamically.
- Charting Mastery: From Bar Charts to Pie Charts, understand when and how to use each type effectively.
- Interactive Elements: Add Dynamic Vertical Group Bars, Option Buttons, List Boxes, and Scroll Bars to your charts for user interaction.
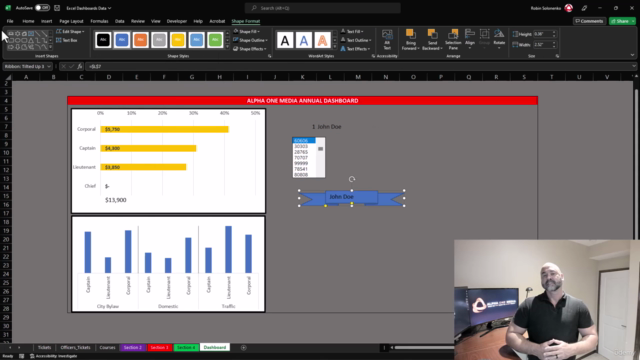
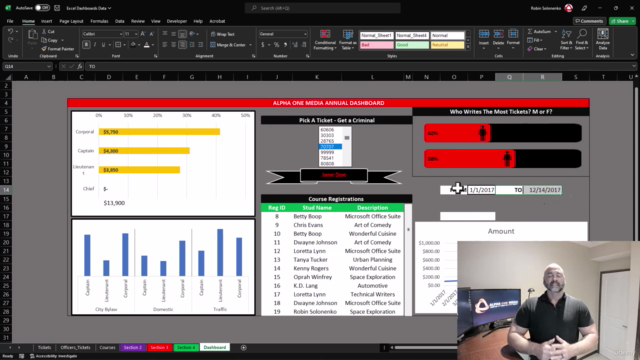
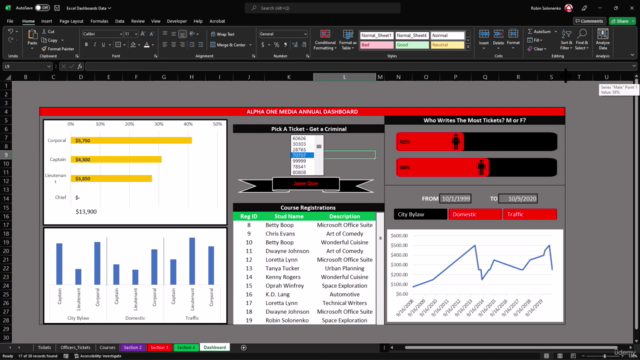
- Dashboard Creation: Combine all elements into a fully functional dashboard that will impress any audience.
Join us for this transformative experience and become an Excel Dashboard Pro! 🧾✨
Please remember, this course is advanced. To get the most out of it, ensure you have a solid understanding of the basics covered in the first three chapters of the manual. Let's elevate your data to new heights together!
Course Gallery


Loading charts...
Related Topics
4955364
udemy ID
31/10/2022
course created date
10/11/2022
course indexed date
Angelcrc Seven
course submited by