Mastering Power BI:Data Analysis and Visualization(Oct 2024)

Why take this course?
🔥 Mastering Power BI: Data Analysis and Visualization 📊 (Oct 2024)
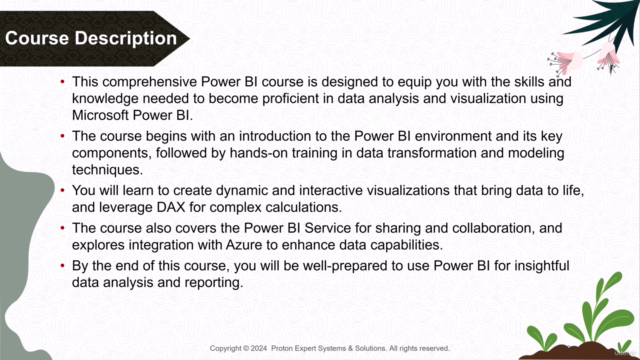
Course Overview: Dive into the transformative world of data with our "Mastering Power BI: Data Analysis and Visualization" course. This dynamic learning journey is meticulously crafted to elevate your expertise in one of the most powerful business analytics tools available – Microsoft Power BI. By completing this course, you will not only unlock the potential within your data but also become adept at creating interactive reports and insights that matter.
What You Will Learn:
-
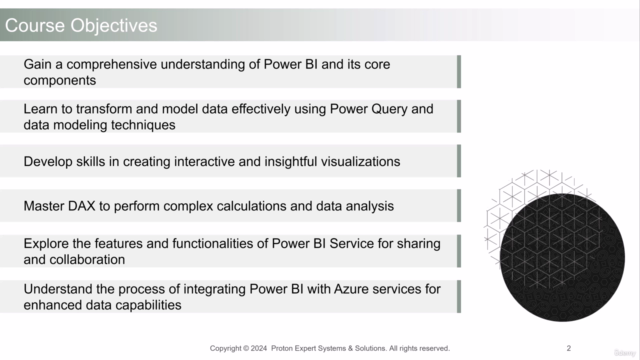
Power BI Fundamentals (Week 1-2): Gain a comprehensive understanding of Power BI’s interface, data connection options, and core functionalities. Learn to import data from various sources and set the groundwork for your analytical journey.
- Connect with different data sources.
- Navigate the Power BI desktop application.
- Prepare and structure data ready for insights-driven analysis.
🔍 Data Transformation & Modeling (Week 3-4): Delve into the art of shaping your data with Power Query, and learn to build secure, scalable, and efficient data models.
- Perform complex data transformations using Power Query.
- Create relationships and hierarchies within your data model.
- Manage calculated columns for precise data representation.
📈 Visualization Mastery (Week 5-6): Turn numbers into stories by creating interactive, insightful dashboards with Power BI’s wide array of visualization tools.
- Design impactful and user-friendly dashboards.
- Utilize slicers, filters, and drill-down capabilities to interact with data.
- Craft compelling narratives through data storytelling.
🧙♂️ DAX Proficiency (Week 7-8): Discover the power of Data Analysis Expressions (DAX) in deriving complex calculations and understanding time intelligence functions.
- Write and optimize DAX measures for accurate insights.
- Apply DAX functions to solve real-world data problems.
- Enhance your reports with sophisticated, yet understandable, analytics.
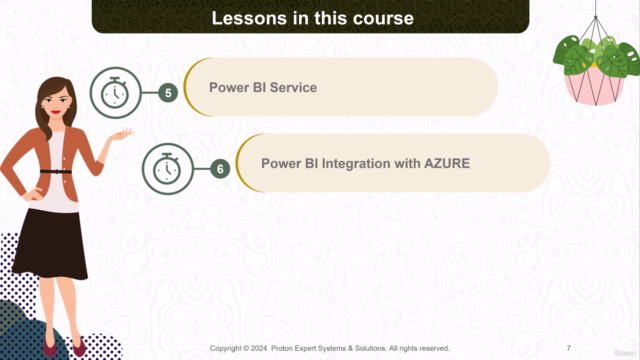
🚀 Publishing & Collaboration (Week 9): Explore the capabilities of Power BI Service and Azure to publish reports, collaborate with teams, and integrate cloud-based resources for advanced data analytics.
- Publish and share your reports in Power BI Service.
- Manage workspaces and collaborate with peers.
- Integrate Power BI with Microsoft Azure for scalable solutions.
Course Highlights:
-
Comprehensive Course Material: Access a wealth of resources, including guided modules, video tutorials, reading materials, and hands-on exercises.
-
Expert Instructor Guidance: Learn from a Proton Expert Systems & Solutions instructor with extensive experience in data analysis and visualization. Experience their insights and real-world expertise firsthand.
-
Peer Collaboration: Engage with fellow learners, participate in discussions, and build your professional network.
-
Certification on Completion: Acquire a certification that signifies your proficiency in Power BI and sets you apart in the job market.
-
Continuous Support: Benefit from ongoing support even after course completion, with resources to keep you updated on new features and best practices.
Embark on this enlightening journey and transform how you view and interact with data! 🌟
Course Gallery


Loading charts...