Tableau for Data Visualisation and Story Telling

Why take this course?
GroupLayout: "2-column" HeadingLevel: "3"
**🌟 Tableau for Data Visualisation and Story Telling **🚀 Course Title 🎓 Learn with Xcourse Team
Course Description
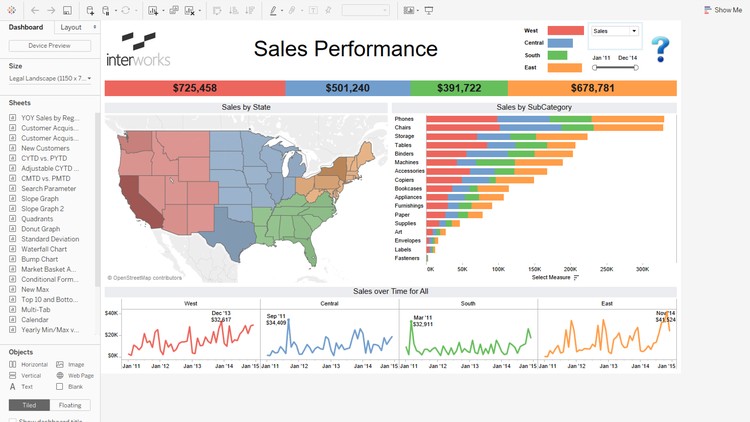
Embark on a data-driven journey with our Tableau for Data Visualisation and Story Telling course, where you'll transform raw data into compelling narratives. Dive into the world of Tableau, a powerful tool that enables anyone to create intuitive and interactive visualisations. By the end of this course, you will not only understand how to draw beautiful graphs but also how to uncover stories within datasets that can drive business decisions.
🔍 Explore Your Data with Ease
- Engage with Diverse Datasets: Work with various datasets and bring their stories to life using Tableau's dynamic visualisation capabilities.
- Master the Art of Graph Selection: Learn the strengths and weaknesses of different types of graphs, from bar charts to scatter plots, to effectively communicate your findings.
- Map Out Success: With just a few clicks, create interactive geographic maps that bring a global perspective to your data analysis.
- Discover Key Insights: Extract critical features and patterns in your dataset, enabling you to identify key business insights effortlessly.
- Present with Confidence: Use data-driven decisions to support your business ideas and presentations with the conviction of a seasoned professional.
👩💻 Why Tableau?
- Intuitive Interface: Tableau's drag-and-drop functionality makes it accessible, even if you're not a programmer. If you know Excel, you're halfway there!
- Interactive Learning Experience: Engage with a course designed to be both informative and engaging, taking you through the fundamentals of data visualisation.
🎓 Hands-On Mastery Awaits
- Step-by-Step Fundamentals: Learn the core skills needed to excel in data visualisation and storytelling with Tableau. You'll cover sorting, filtering, grouping, and more.
- Sort, filter, and group your data
- Create tables, bar charts, line charts
- Show location using geographic maps
- Aggregate with functions like sum, average, min, max, and counts
- Create new fields using calculations
- Combine data using joins and blends
🛠️ Get Hands-On with Tableau To truly master the art of data visualisation, you'll need to put theory into practice. By installing the free Public version of Tableau software on your computer and working with the included sample dataset, you'll answer questions that reinforce the skills covered in the videos. This hands-on approach ensures that you not only understand the concepts but can apply them effectively.
📆 Start Your Data Visualisation Adventure Today! With Tableau for Data Visualisation and Story Telling, you're not just learning a set of skills - you're embarking on a journey to unlock the potential of your data. Enroll now and take the first step towards becoming a data visualisation expert with Tableau.
Loading charts...