Interactive Python Dashboards with Plotly and Dash
Why take this course?
🌟 Course Title: Interactive Python Dashboards with Plotly and Dash
🚀 Headline: Learn how to create interactive plots and intelligent dashboards with Plotly, Python, and the Dash library!
Course Description:
Embark on a journey to master data visualization and dashboard creation with Python using the powerful Plotly and Dash libraries. This comprehensive course is designed for individuals eager to elevate their Python skills to craft dynamic and insightful interactive dashboards. 📊✨
Why Choose This Course?
- Cost-Effective: Gain a bootcamp-level experience at a fraction of the cost, offering exceptional value for your investment.
- Self-Paced Learning: Access the course materials anytime, anywhere, fitting seamlessly into your schedule.
- Hands-On Approach: With example code, explanatory videos, and interactive exercises, you'll apply what you learn in real-time.
- Community Support: Engage with fellow students through our supportive chat channels and active Question and Answer Forums.
Course Breakdown:
Section 1: Data Manipulation Crash Course 🛣️
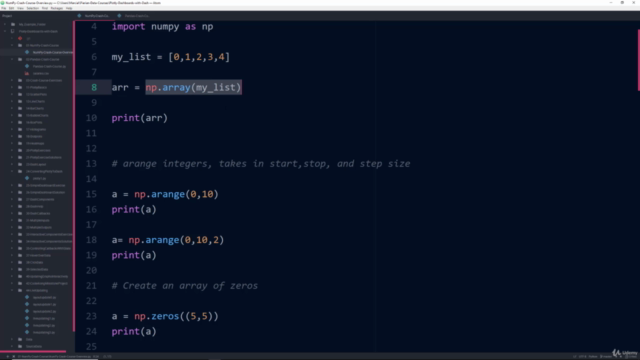
- Get up to speed on essential libraries like Numpy and Pandas for data preparation and manipulation.
Section 2: Introduction to Plotly for Data Visualization 🎨
- Learn how to create a variety of static plots with Plotly, including scatter plots, line charts, and more.
- Understand best practices for selecting the right plot type for your data.
Interactive Exercises: 🔍
- Put your newly acquired skills to the test with hands-on tasks that reinforce your learning experience.
Section 3: Deep Dive into Dash and Interactive Components 🤖
- Explore the Dash library for creating interactive dashboards.
- Master callbacks, layout design, and handling multiple inputs and outputs.
- Create sophisticated interactive components to enhance user engagement.
Section 4: Real-Time Data Visualization ⏰
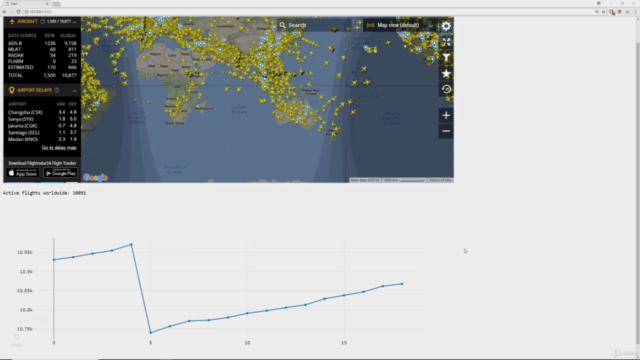
- Learn how to set up dashboards that update in real time with live data feeds.
- Deploy your dashboard projects to the web using Heroku for a live, interactive experience.
What You Will Gain:
✅ Skills Certification: Showcase your expertise with a certification you can add to your LinkedIn profile. 📄 Portfolio of Projects: Build and own a portfolio showcasing your interactive dashboard projects. 🛠️ Industry-Relevant Knowledge: Stay ahead of the curve with the latest technology in data visualization. 🚀 Deployment Experience: Learn to deploy dashboards live to the web using Heroku.
Enrollment Benefits:
- Money-Back Guarantee: Try the course risk-free with a 30-day money-back guarantee.
- Community and Expert Support: Receive guidance and feedback from both peers and instructors.
- Lifetime Access: Return to the course material anytime for a refresher or deeper understanding.
Don't miss out on this opportunity to become a data visualization expert with Python! 🚀 Enroll in "Interactive Python Dashboards with Plotly and Dash" today and transform your data into captivating visual stories. Let's dive into the world of interactive dashboards together! 🌐✨
Course Gallery

Loading charts...
Comidoc Review
Our Verdict
Interactive Python Dashboards with Plotly and Dash
What We Liked
- Covers a wide range of topics related to Plotly and Dash, providing a solid foundation for creating interactive plots and dashboards.
- The instructor is knowledgeable and passionate, delivering clear explanations that make complex ideas accessible.
- Includes exercises at the end of each lecture to practice theoretical knowledge and improve understanding.
- Highlights real-life use cases demonstrating how to integrate Dashboards into professional environments.
Potential Drawbacks
- Some course content is outdated, causing issues when working with newer libraries, dependencies or tools. This may require additional problem-solving skills from learners.
- Explanations could occasionally be more specific and in-depth to facilitate learning for absolute beginners.
- The course's pace varies; the quality of instruction is superior at the beginning but diminishes as lectures progress, particularly around lecture 62.