HR Analytics Dashboard using Excel - People Analytics Basics

Why take this course?
🌟 Course Headline:
🎓 Mastering HR Analytics: Build an Interactive HR Dashboard in Excel and Generate Meaningful Insights from Employee Data! 📊✨
Course Description:
As an HR professional, your role extends beyond just managing people. It's about leveraging data to inform strategic decisions and drive organizational success. In this comprehensive course, "HR Analytics Dashboard using Excel - People Analytics Basic," you will embark on a journey to master the art of HR analytics by creating an interactive dashboard in MS Excel.
Why You Should Take This Course:
- Real-World Application: Learn with real-world data from a fictional company, making the lessons practical and directly applicable to your own organization.
- No Excel Experience Required: Whether you're an HR professional, leader, or anyone interested in data analysis, this course is designed for all levels, especially those with little to no MS Excel experience.
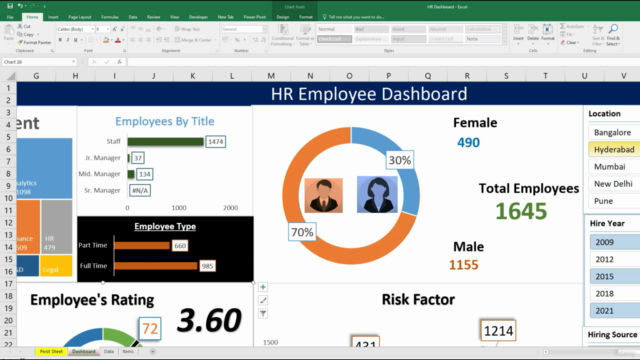
- Hands-On Learning: Through a series of hands-on exercises, you will import external data, clean and transform it, and create pivot tables and interactive charts that provide deep insights into your employee headcount.
- Interactive & Insightful: You'll learn to create dashboards that allow for drill-down capabilities, giving you a closer look at the data for more meaningful analysis.
- Data Presentation Skills: By the end of the course, not only will you have built a fully functional HR employee headcount dashboard, but you'll also know how to present your findings confidently to senior leadership and stakeholders.
What You Will Learn:
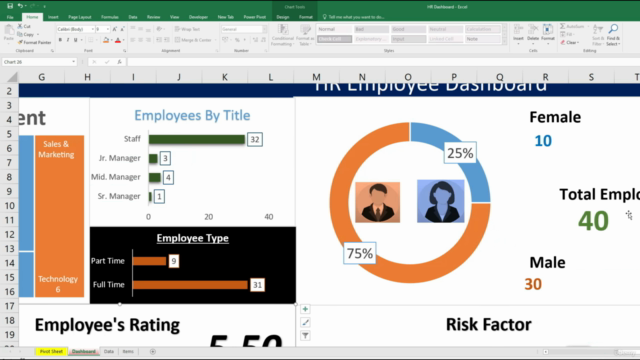
🚀 Importing data from external sources into MS Excel Data cleaning and transformation for accurate analysis Creating pivot tables and pivot charts to summarize data efficiently Designing interactive charts and graphs that bring your data to life Using conditional formatting to visually identify trends, outliers, and patterns in the data Building a HR employee headcount dashboard with various filters such as department, job title, and location Utilizing Speedometer Chart and other visualization techniques to present data effectively Creating a Performance Rating Dashboard to evaluate and track employee performance Identifying High Risk vs Low Risk employees for better talent management Calculating and defining data by AGE, education background, and more Determining who is eligible for future promotion within your company
Who This Course Is For:
👥 HR professionals looking to track and manage employee headcount Managers, leaders, and decision-makers who want to incorporate headcount performance data into their company strategy Individuals with an interest in data analysis and learning MS Excel Professionals with little to no experience using MS Excel but willing to learn
Prerequisites:
By the end of this engaging and informative course, you will have the tools and knowledge to create an HR employee headcount dashboard in MS Excel, enabling you to make data-driven decisions that can shape the future of your organization. 📈💼
Enroll now and transform the way you handle HR analytics! Let's turn numbers into narratives, and data into decisions. 🚀🎓
Course Gallery


Loading charts...