Data Visualization with Microsoft Power BI for Data Science

Why take this course?
📊 Unlock the Secrets of Your Data with Data Visualization using Microsoft Power BI 🎉
Course Title: Data Visualization with Microsoft Power BI for Data Science
Headline: Transform Data into Impactful Insights with Expert Power BI Training!
Embark on a transformative learning journey with our comprehensive course, "Data Visualization with Microsoft Power BI for Data Science." This course is meticulously designed to take you from the basics of data visualization to the advanced functionalities of Power BI, equipping you with the skills necessary to extract meaningful insights from your datasets.
Course Description:
📈 Dive into the World of Data Visualization: Master the art and science of data storytelling with Power BI, a robust tool for Business Intelligence that's revolutionizing the way we understand and present data. Whether you're a seasoned data scientist or an analyst looking to enhance your skillset, this course will guide you through the process of turning complex datasets into compelling visual stories.
Understanding Power BI: Power BI by Microsoft is not just a visualization tool; it's a comprehensive platform for Data Science and Business Intelligence that empowers you to perform data preparation, visualization, and analysis with ease. It's designed to cater to a wide range of users, from those who are new to data analysis to seasoned professionals.
- Data Preparation: Get hands-on experience with the Query Editor to shape your data exactly as needed for analysis.
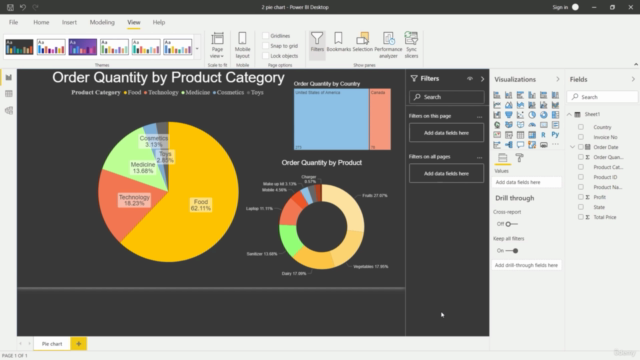
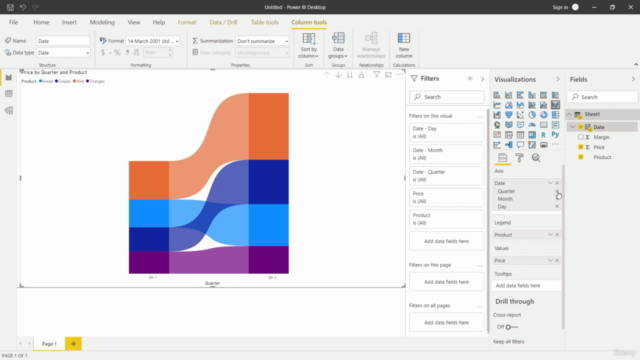
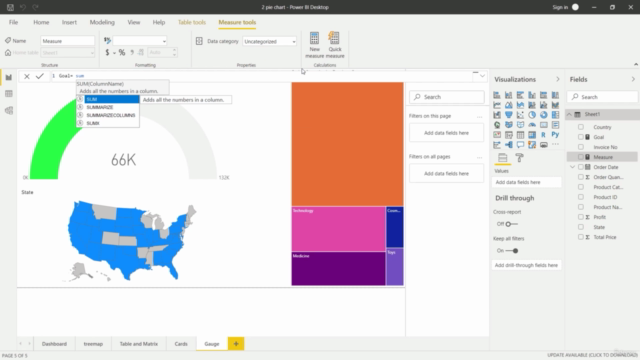
- Dynamic Visualization: Explore a variety of visualization options including Ring, Pie, Line, Treemap, Gauge, Table, Matrix, Ribbon, and Scatterplot Charts, each serving different purposes and providing unique insights.
- Advanced Customization: Learn to drill down into data layers, include or exclude specific datasets, create custom measures and calculated fields, and much more to tailor your reports for precise analysis.
Power BI's Advanced Features: The course also delves into advanced features that will elevate your report creation capabilities:
- Live Web Data: Learn to pull in real-time data from the web directly into your reports.
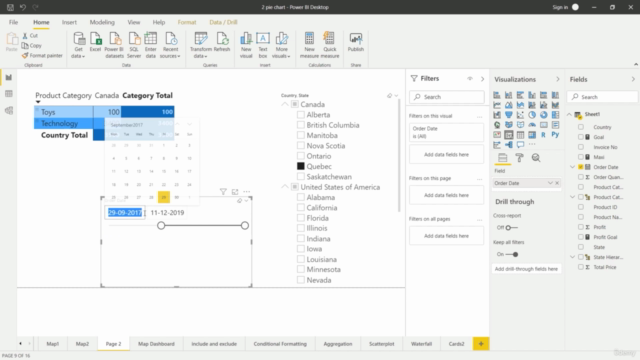
- Slicers: Use Category and Date Slicers to filter and manage your datasets efficiently.
- Exporting Reports: Share your findings by exporting them as PDFs or data subsets as CSV files.
Learning Pathway: With dedication and consistent practice, you can learn the fundamentals of Power BI in just a week. Our course is structured to help you build a strong foundation with hands-on exercises and real-world examples. The journey to becoming proficient with Power BI starts here!
Why Learn Power BI? Power BI is increasingly becoming the tool of choice for organizations worldwide due to its user-friendly interface, powerful analytical capabilities, and seamless integration with other Microsoft products. Learning Power BI opens up a plethora of opportunities in Data Science, Analytics, and Business Intelligence across various industries.
Join Us Now! Embark on this transformative learning adventure and unlock the full potential of your data. With "Data Visualization with Microsoft Power BI for Data Science," you'll gain the skills to craft compelling reports and dashboards that can guide strategic business decisions. 🚀
Enroll today and become a master in turning numbers into narratives! 💫
Course Gallery
Loading charts...