Data Visualization with MATLAB - Projects and Examples

Why take this course?
📆 Course Title: Data Visualization with MATLAB - Projects and Examples
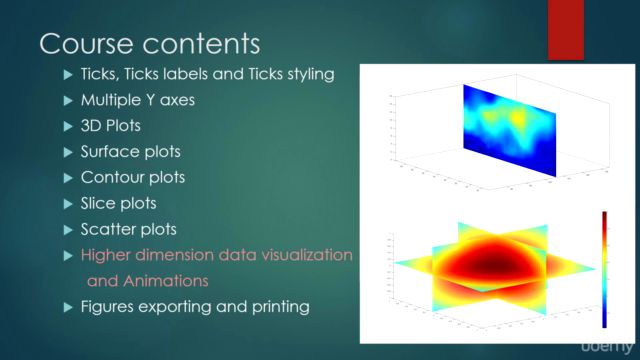
🚀 Headline: Master the Art of Visualizing Data in 2D, 3D, 4D, 5D and Craft Animated Plots with Over 100+ Projects and Examples!
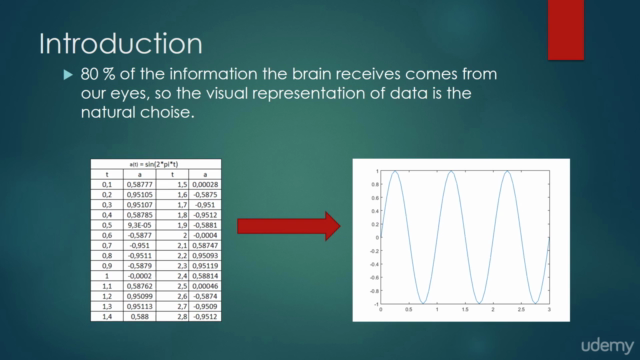
🔍 Why Visualize Data? Visualizing data is crucial as the sheer volume and intricacy of information continue to escalate. In this course, we delve into the importance of presenting data in an intuitive manner, allowing us to comprehend complex phenomena and abstract mathematical concepts with ease. Given that 80% of our sensory information comes from visual inputs, it's imperative to effectively use graphical representation to communicate findings, highlight key insights, and narrate data stories coherently.
👀 Why MATLAB? MATLAB stands out as a robust tool for data visualization due to several compelling reasons:
-
Ease of Use: With its intuitive programming language and built-in development environment, writing, modifying, and debugging programs in MATLAB is a breeze.
-
Platform Independence: MATLAB's versatility shines through as it supports various operating systems, including Windows, Linux, Unix, and Macintosh, ensuring your work is not platform-restricted.
-
Device-Independent Plotting: MATLAB offers a suite of powerful plotting and imaging commands that work across different devices, making it a versatile choice for visualizing data.
-
Full set capabilities: MATLAB's comprehensive toolkit allows you to create detailed scientific and engineering plots. It supports 2D & 3D diagrams, volume visualization, animations, interactive creation of diagrams, and the ability to export your work in popular formats. Customization options are abundant – from multiaxes to custom colors, annotations, legends, and more.
🎓 Why this Course? This course is meticulously designed to make complex plotting techniques accessible through simple steps. Our professional trainers will guide you with an easy-to-follow approach that's perfect for students, academics, scientists, and beginner programmers alike. Here's what you can expect from this comprehensive learning journey:
-
Simplistic Steps: We break down advanced plotting into manageable chunks, making it easier to grasp and apply.
-
Expert Guidance: Our professional trainers bring a wealth of knowledge and experience to help you master MATLAB's data visualization capabilities.
-
Real-World Applications: With over 100 projects and examples, you'll gain hands-on experience that spans across various fields and applications.
-
Flexible Learning: This course is designed for flexibility, allowing you to learn at your own pace and on your own schedule, with the support of a vibrant learning community.
Enroll now to unlock the full potential of your data with MATLAB and become a visualization virtuoso! 🌟
Course Gallery


Loading charts...