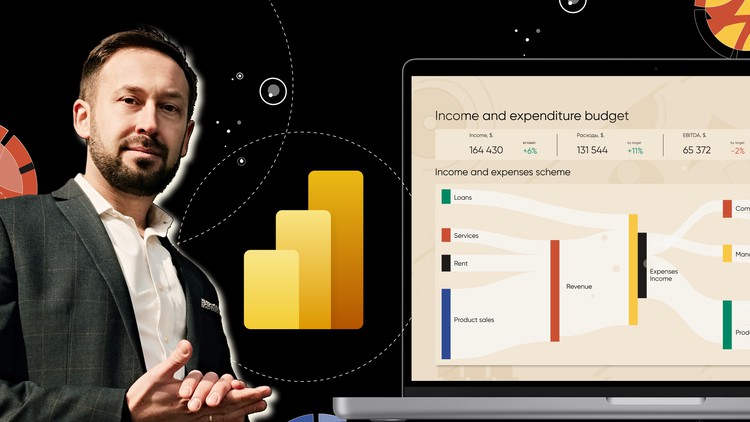
Data storytelling with Power BI

Why take this course?
🌟 Master Data Storytelling with Power BI: Advanced Visualization & Interactive Data Lifehacks 🌟
Are you ready to transform raw data into compelling narratives? With Data Storytelling with Power BI, you'll not only learn the intricacies of advanced visualization but also discover life-saving data processing hacks that will make your analysis efforts a breeze. This course, led by the esteemed Alex Kolokolov, is tailored for those who wish to master the art of interactive data stories and elevate their data analytics skills to new heights.
Course Breakdown:
🚀 Module 1: Understanding Data Structures & Basic Visualization
- Recap the foundational elements of data structures.
- Learn to create and manipulate basic visuals with ease.
📈 Module 2: Key Performance Indicators (KPIs) & DAX Calculations
- Dive deep into KPIs that matter for your business.
- Master the art of DAX calculations to uncover hidden insights in your data.
🛠️ Module 3: Interactive Capabilities of Power BI
- Explore mutual diagram filtering and understand its power.
- Utilize pop-up tooltips to provide context at a glance.
- Learn how to implement and manage bookmarks for seamless navigation.
🎨 Module 4: Advanced Visualization with AppSourse Catalog
- Discover the most effective advanced visuals available.
- Easily apply these visuals to create impactful, interactive dashboards.
📝 Module 5: Dashboard Design & Storytelling
- Craft a dashboard that tells a compelling story about your data.
- Learn how to present complex data in an easily digestible format.
🚀 Module 6: Presenting with AIDA & Elevator Pitch Techniques
- Understand the AIDA model for effective data presentation.
- Prepare an engaging Elevator Pitch for your dashboard.
Hands-On Learning:
✅ After each module, you'll complete a creative task to apply what you've learned. ✅ Reinforce your knowledge with theoretical tests that will ensure your mastery of Power BI and data storytelling techniques.
By completing this course, you will be equipped to:
- Design, connect, and present your own interactive dashboards.
- Utilize Google services to enhance your data analysis capabilities.
- Captivate your audience with compelling data stories that inform, engage, and persuade.
Don't miss out on this opportunity to become a Power BI Data Storytelling expert! 📊🎓 Enroll now and start your journey towards transforming data into dynamic insights that can influence decision-making and drive your business forward.
Loading charts...