Create Infographics with Adobe Illustrator
Why take this course?
🎉 Master Data Visualization with Infographics in Illustrator! 📊🎨
Course Title: Create Infographics with Adobe Illustrator
Headline: Dive into the World of Infographics - Unleash the Power of Visual Storytelling with Bar, Pie, Line, Area & Stacked Charts in Illustrator!
Course Description:
Embark on a journey to transform raw data into compelling visual stories with our comprehensive online course, "Create Infographics with Adobe Illustrator." This isn't just about creating charts; it's about bringing data to life. You'll learn to craft captivating infographics that not only present data clearly but also tell a story and engage your audience.
Why Learn Data Visualization?
In an era where visual content reigns supreme, the ability to create attractive and informative charts has become invaluable. From marketing to analytics, every industry craves data visualizations that not only represent numbers but also tell a story. As we move forward, the demand for skilled graphic designers who can translate complex data into compelling graphics will only grow.
What You'll Learn:
📈 Practical Skills: This course is designed to take you through a series of practical lessons where you'll learn Adobe Illustrator's tools and techniques to create various types of charts, including:
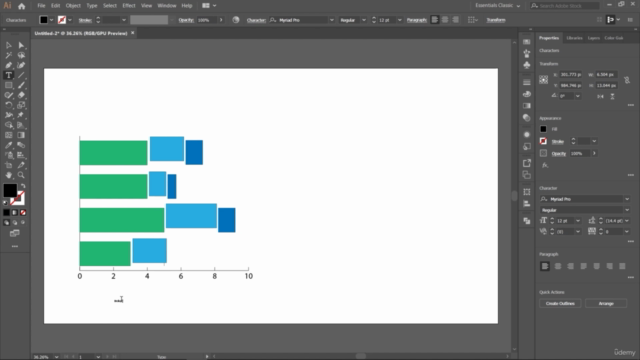
- Bar Chart: Understand the basics and learn how to design a bar chart that stands out.
- Line Graph: Master the art of showing trends over time with line graphs.
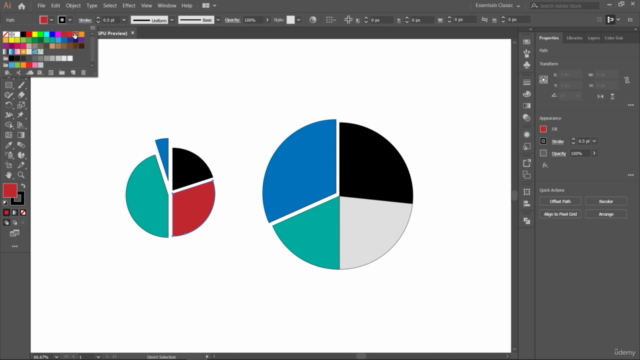
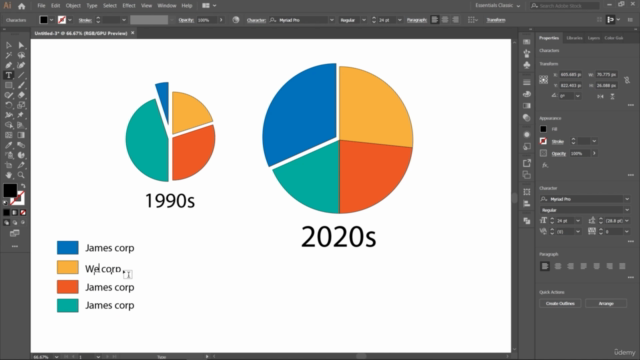
- Pie Chart: Slice up your data and present it in a pie that's both delicious and informative.
- Stacked Chart: Layer your data to show individual contributions within a group.
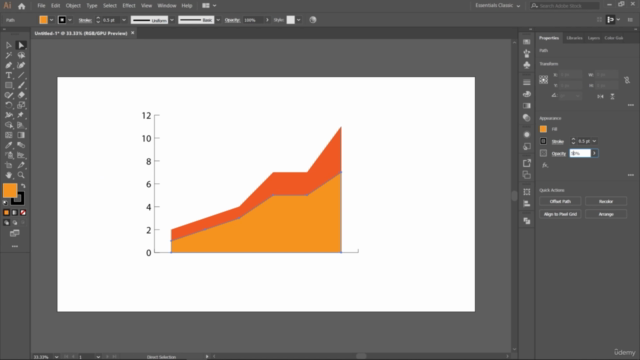
- Area Graph: Illustrate the magnitude of change over time with area graphs.
- Extrude and Bevel 3D: Add depth to your charts with stunning 3D effects.
- Isometric Cylinder Coins: Create unique isometric graphics that add a modern twist to your visuals.
- Envelop Distort: Transform shapes to fit text or other objects, perfect for dynamic layouts.
- Type on Path & Area Type: Combine typography with illustration to create impactful messages and designs.
Who Should Take This Course?
This course is ideal for:
- Aspiring graphic designers looking to expand their skill set.
- Marketing professionals who want to present data in a more engaging manner.
- Business analysts or data scientists seeking to visualize their findings in a visually appealing way.
- Anyone interested in learning Adobe Illustrator's advanced features for data visualization.
Your Creative Journey Awaits!
By the end of this course, you'll not only be equipped with the skills to create beautiful and functional charts but also understand how to effectively communicate a message through data visualization. Let's make data analysis exciting and accessible! 🌟
Enroll now and start your transformation into a master infographic creator with Adobe Illustrator. Your next project awaits, and it's going to be spectacular! 🚀✨
Course Gallery
Loading charts...