Building Technical Indicators in Python

Why take this course?
🧠 Dive into Financial Markets with Python!
🚀 Course Title: Building Technical Indicators in Python
🏫 Instructor: Satyapal Singh
👀 Course Headline: Master the Art of Trading Strategies by Learning to Use Technical Indicators and Candlestick Patterns with Python!
Course Description:
Embark on a journey to understand and apply the power of technical analysis in stock trading using Python. This comprehensive course is designed for students who aspire to decode the secrets of financial markets through technical indicators and candlestick patterns. Whether you're an investor, trader, or a programming enthusiast, this course will equip you with the skills to create, analyze, and implement technical trading strategies effectively in Python.
📚 Course Outline:
-
Introduction to Technical Indicators & Candlestick Patterns: Gain an overview of how these tools are used in stock trading to predict market movements.
- Understanding the significance of third-party libraries in enhancing your strategies.
-
Diving into Technical Indicators: Learn about and apply some of the most influential indicators:
- 📈 Simple Moving Average (SMA)
- 📈 Exponential Moving Average (EMA)
- 📈 Relative Strength Index (RSI)
- 📈 Moving Average Convergence Divergence (MACD)
- 📈 Bollinger Bands
- 📈 Fibonacci Retracements
-
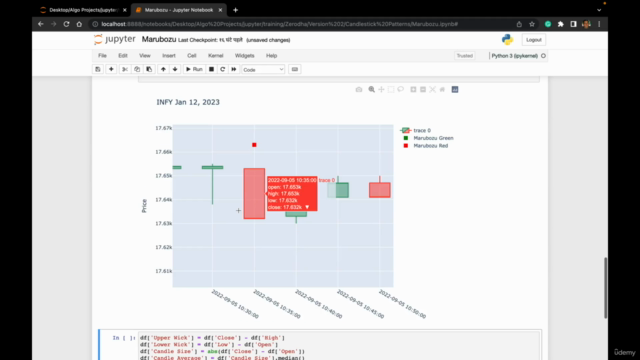
Understanding Candlestick Patterns: Recognize and interpret popular patterns that signal market trends:
- 🌰 Doji
- 🌰 Hammer
- 🌰 Shooting Star
-
Libraries and Tools: Get hands-on experience with Python libraries that will aid in the calculation and plotting of indicators and patterns:
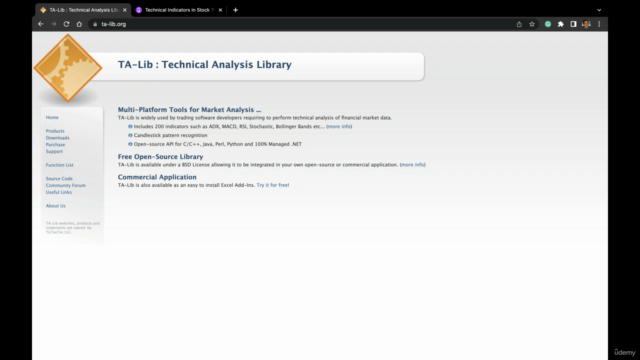
- 📊 Talib for implementing technical indicators
- 📊 Pandas TA for data manipulation and analysis
- 📊 Tulip for building trading strategies
- 📈 Matplotlib, Plotly, & Mplfinance for visualizing your data and indicators on price charts
-
Mathematical Foundations: Explore the mathematical formulas underpinning these indicators and learn how to use them to your advantage, or even develop your own custom indicator.
-
Real-World Application: By integrating the concepts learned throughout the course, you'll be able to:
- Calculate technical indicators and candlestick patterns.
- Analyze market trends with a data-driven approach.
- Make informed trading decisions based on solid evidence.
Why Take This Course?
✅ Practical Skills: Acquire the knowledge to use Python for real-time financial analysis. 📊 Advanced Tools: Learn to leverage powerful libraries and tools to enhance your trading strategies. 🤔 Critical Thinking: Develop a deeper understanding of market movements and trends through technical indicators and candlestick patterns. 🤝 Community Support: Join a community of like-minded individuals who share your passion for trading and programming.
By the end of this course, you'll have a solid foundation in using Python to interpret technical indicators and candlestick patterns, enabling you to make profitable trades with confidence. 🌟
Enroll now and transform your approach to trading with the power of Python! 🚀
Course Gallery


Loading charts...