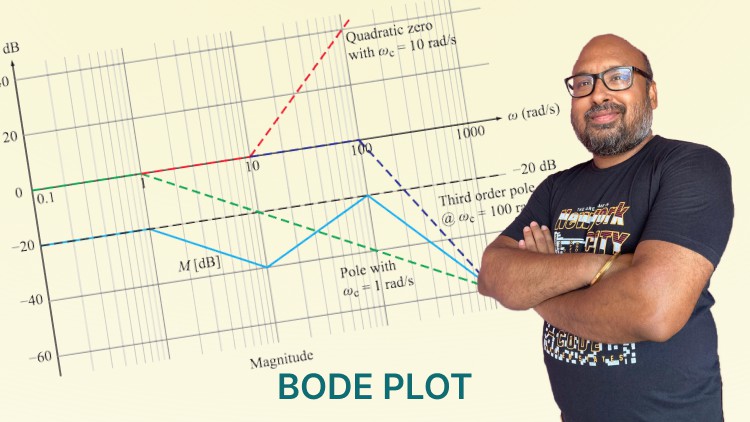
Bode Plot

Why take this course?
Mastering Signal Analysis with Bode Plots: A Comprehensive Guide for Engineers
📚 Course Title: Mastering Signal Analysis with Bode Plots: A Comprehensive Guide for Engineers
Unlock the Secrets of System Frequency Response 🚀
Welcome to the "Mastering Signal Analysis with Bode Plots" course, where you'll embark on a journey to understand the intricacies of system frequency response. Led by the expert tutelage of Kishore Kashyap, this course is meticulously designed for engineers who aim to master the Bode plot technique for analyzing and designing systems.
Course Overview:
This course is a deep dive into the world of Bode plots, where you'll learn how to interpret and apply these powerful tools in real-world scenarios. You'll cover:
-
Magnitude Bode Plot Variations:
- Starting with zero slope (0 dB/Decade)
- Transitioning to negative slope (-20 dB/Decade for RC circuits, for instance)
- Progressing to positive slope (typically found in RL circuits)
-
Phase Bode Plot Analysis:
- Understanding the phase behavior of systems
- Learning how phase shifts impact system performance
-
Gain and Phase Margin Analysis:
- Calculating gain margin and phase margin to assess system stability
- Applying these concepts using Bode plots
What You'll Learn:
-
Bode Plot Fundamentals:
- The significance of Bode plots in the frequency domain behavior of systems
- How Bode plots offer a quick and easy approximation of system gain and phase responses
-
Approximation Techniques:
- Learning the rules for drawing approximate Bode magnitude and phase plots
- Transitioning from straight-line approximations to the actual smooth curves on the plot
-
Bode Plot Units and Interpretation:
- Understanding the importance of dB/Decade in slope determination
- Interpreting Bode phase plots for system phase shift dependencies
-
Historical Context and Applications:
- The legacy of Hendrik Wade Bode in control systems theory and telecommunications
- Applying Bode plot techniques in circuit design and analysis, especially for operational amplifier circuits
-
Graphical Representation:
- Utilizing logarithmic scales for magnitude and phase angle plots
- Drawing both magnitude and phase angle plots on the same semi-log graph paper for a comprehensive view
Why Take This Course?
- Practical Skills: Gain hands-on experience in plotting and analyzing Bode plots, which are essential for understanding system behavior.
- Theoretical Knowledge: Understand the underlying principles that make Bode plots a valuable tool in signal processing.
- Professional Development: Equip yourself with skills that will enhance your problem-solving capabilities and career prospects in the field of engineering.
Join Us on This Analytical Adventure!
Whether you're a seasoned engineer or just starting out, this course will provide you with the knowledge and practical skills to confidently interpret and create Bode plots. With Kishore Kashyap as your guide, you'll learn how to analyze systems effectively, predict response characteristics under various conditions, and design robust systems that can handle a wide range of frequencies.
Enroll now and take the first step towards becoming an expert in signal analysis with Bode plots! 🎓✨
Key Takeaways:
- Understand Bode Plot Types: Zero, negative, and positive slope Bode magnitude plots, and phase Bode plots.
- Learn Approximation Techniques: Draw approximate Bode plots and understand how to transition to the actual curves.
- Master the Logarithmic Scale: Use semi-log graph paper to plot both magnitude and phase angle responses for comprehensive analysis.
- Analyze System Stability: Calculate gain and phase margins to ensure system stability and performance.
Ready to Dive into the Frequency Domain? 🌊
Let's embark on this analytical journey together! Enroll in "Mastering Signal Analysis with Bode Plots" today and transform your understanding of systems and signal processing. Your engineering expertise awaits!
Loading charts...