Tableau Desktop - Advanced Data Visualization & Dashboards

Why take this course?
🚀 Advanced Tableau for Business Intelligence & Data Analysis 🚀
Welcome to the ultimate journey in mastering advanced Tableau Desktop skills! If you're an aspiring data analyst, business intelligence professional, or simply looking to elevate your data analysis and visualization capabilities with Tableau 2020.2+, you've found the right course.
👩💼 Course Overview: This is not just another online course; it's a comprehensive, hands-on, project-based adventure that will transform your approach to data analysis. As you step into the role of an analyst at Maven Roasters, a bespoke small batch coffee roasting company, you'll tackle real-world business intelligence challenges with cutting-edge Tableau techniques.
📈 What You'll Learn:
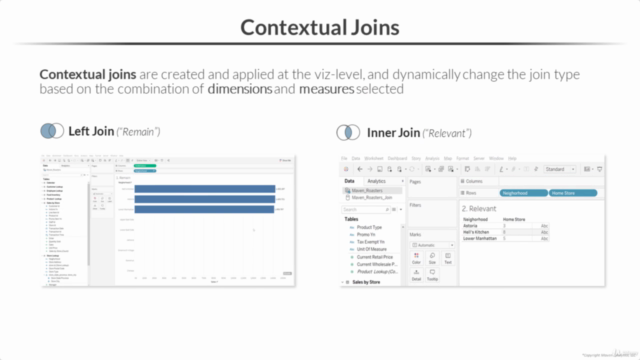
- 🔗 Tableau Relationships: Dive into the intricacies of logical and physical layers, contextual joins, smart aggregation, and performance optimization to create robust data models.
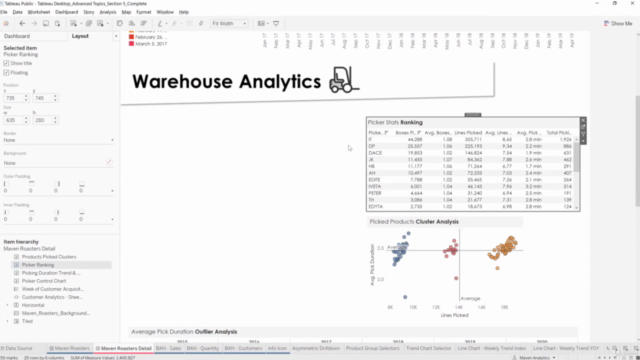
- ✨ Dynamic Design: Master custom templates, KPI shapes, dynamic formatting, and filter menus to create visually stunning and user-friendly dashboards.
- 👾 Parameter & Set Actions: Explore the world of interactivity with relative dimensional analysis, animations, color scaling, and more to engage your audience like never before.
- 🌍 Geospatial Mapping: Leverage spatial functions, custom territories, hierarchies, and background maps to visualize location-based data effectively.
- 🧮 Advanced Calculations: Get to grips with Regular Expressions (RegEx), advanced table calculations, LOD functions, cohort analysis, and more to perform complex data manipulations.
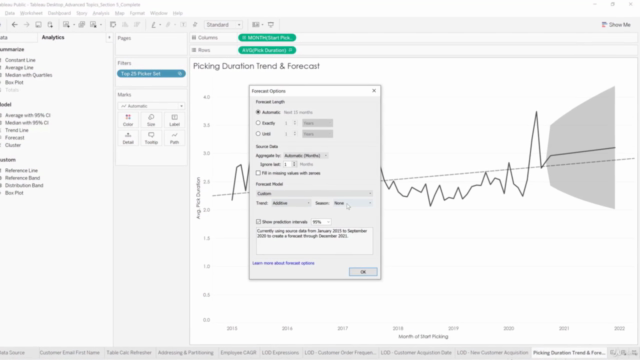
- 📊 Predictive Analytics: Discover the power of regression models, forecasting, and predictive analysis within Tableau to provide insights beyond current trends.
📚 Bonus Resources:
- An advanced eBook on Tableau Desktop
- Downloadable Tableau project files & solutions for hands-on practice
- Homework assignments & quizzes to test your knowledge
- Access to a course Q&A forum for support and collaboration
- A 30-day money-back guarantee to ensure your satisfaction
🏅 Why Choose Maven Analytics? With courses among the TOP-RATED and BEST-SELLING on Udemy, Maven Analytics stands out for its exceptional quality and effectiveness in teaching data analysis tools like Excel, Power BI, MySQL, and, of course, Tableau.
🚀 Student Testimonials: "Some of the BEST courses I've ever taken... Maven Analytics should become the new standard for all courses taught on Udemy!" - Russ C.
"This is my fourth course from Maven Analytics and my fourth 5-star review... I wish Maven was in my life earlier!" - Tatsiana M.
"Excellent from start to finish... I loved all of it!" - Robert C.
💡 Join the Community: Don't just take our word for it; join over a thousand students who have enhanced their careers with the skills they've learned from Maven Analytics. Enroll in this course today and start your journey to becoming a data analysis expert!
🔥 Ready to Dive In? Click that 'Enroll Now' button and let's embark on this exciting learning adventure together. See you inside the course, where we'll turn data into insight and insights into action with Tableau! 📊💡
-Dustin, Featured Tableau Author & Lead Tableau Instructor at Maven Analytics
Course Gallery


Loading charts...